Federal elections: how the pollsters predict
Online surveys have replaced telephone calls for measuring public opinion in the lead up to federal elections. With the aid of graphics, we examine the process.
Graphics: CANA atelier graphique
For the first time, the political preferences of the Swiss population ahead of a federal election are being measured only by online surveys – and no longer by telephone.
Internet surveys have one major advantage: they cost much less. Data is collected much more easily by means of questionnaires that can be distributed across electronic media portals which Internet users can then fill in themselves. Within a few days, thousands of responses can be collected.
But wait, don’t hang up just yet. According to the co-director of GfS Bern, Urs Bieri, telephone surveys may be “incorrectly considered obsolete”, as “almost everyone” can still be reached through this means. He reminds us that the use of mobile numbers has reduced the coverage problem.
Bieri is surprised that, unlike other countries, Switzerland is not debating this subject. He points out that in Germany, in particular, telephone surveys remain the benchmark and have come back in fashion in the United States after a boom in online surveys. His institute combines results from both kinds of survey for votes on initiatives and referenda.

![]()
A press group commissions an opinion poll by a specialised institute in the run-up to federal elections. It in turn publishes a questionnaire on the websites of the group’s newspapers. This becomes the sole source of the survey.
Some researchers are looking at other potential sources, such as social networks. The political scientist Pablo Barbéra of the London School of Economics has shown that it is possible to determine the ideological position of Twitter users by analysing the accounts to which they subscribe. But predicting the outcome of elections requires knowing if they intend to vote. And for that, a survey is needed.
![]()
Jack Brown reads the newspaper on his smartphone. He comes across the survey and decides to participate. He provides information about himself (gender, age, etc.) and says which party he would vote for – were the elections to be held on the same day. This information is compiled into a database.
Parties like the Swiss People’s Party (SPP) are giving pollsters a hard time. In 2011 they had not foreseen their declining composition in the National Council. Before the Zurich elections on 24 March 2019, Sotomo announced a 1.8-point drop for the SPP, only for it actually to fall by 5.6 points. Bieri links this to the profiles of some of the party’s voters: protesters who are not necessarily very politicised and those who sometimes decide to vote at the last minute. Lucas Leemann of LeeWas does not rule out a “surprise” for the SPP in the upcoming federal elections in October 2019.
![]()
In the space of two days, 14,000 responses are collected. Then the survey is closed and the data analysis begins. On the basis of the sample collected, the aim is to extrapolate the intentions of all persons planning to vote.
The first step in the data analysis is to remove all but the most reliable data. About 15 percent are rejected, for reasons such as being incomplete or of dubious quality. The pollsters then apply a methodology known as MRP (multilevel regression with post-stratification): i.e., classifying the voting intentions of respondents according to demographic parameters (age, education, etc.), and creating response models for standard ideals, e.g., young woman living in an urban commune in the canton of Zurich and supporting a particular party. All that remains is to adjust these preferences in line with the demographic proportion of these models in the actual electoral population, based on official statistics.
![]()
Once the calculations are completed, the pollsters compile the results into a report and send it to the media, specifying a margin of error of 1.5 percent.
A margin of error of 1.5 percent means that a party’s actual score may be 1.5 points higher or lower than the result indicated in the survey. This will depend on not only the number of participants, but also their distribution. If, for example, only male academics had answered the survey, the margin of error would be very high. Reference is always made to a confidence interval, most often 95 percent. Statistically speaking, the results are 95 percent likely to fall within the margin of error.
![]()
The journalist Jean Bridgewater is preparing an article based on the results of the survey. She calls the authors because she has questions about its reliability. Hasn’t a bias been introduced by relying only on responses from people who read online media?
For Leemann, there is an advantage to people interested in current affairs participating most in opinion polls, not a bias: “They are also the ones who are most likely to vote. It is therefore a form of self-selection that contributes to our work. What would be detrimental is if the people most likely to vote never participated in the polls, although it’s difficult to imagine such a profile”. For this reason, he sees little use in estimating participation.
![]()
The media publishes the results of the survey alongside commentary from political parties and analysts. Jack Brown sees that his favourite party is down 1.5 points. But it won’t influence his voting intentions.
Numerous studies have been conducted to determine whether survey results influence voters. They have all concluded that the effects are negligible. At worst, they cancel each other out: some people are influenced in one direction and some in the other. Both Bieri and Leemann share the findings of the research conducted so far.
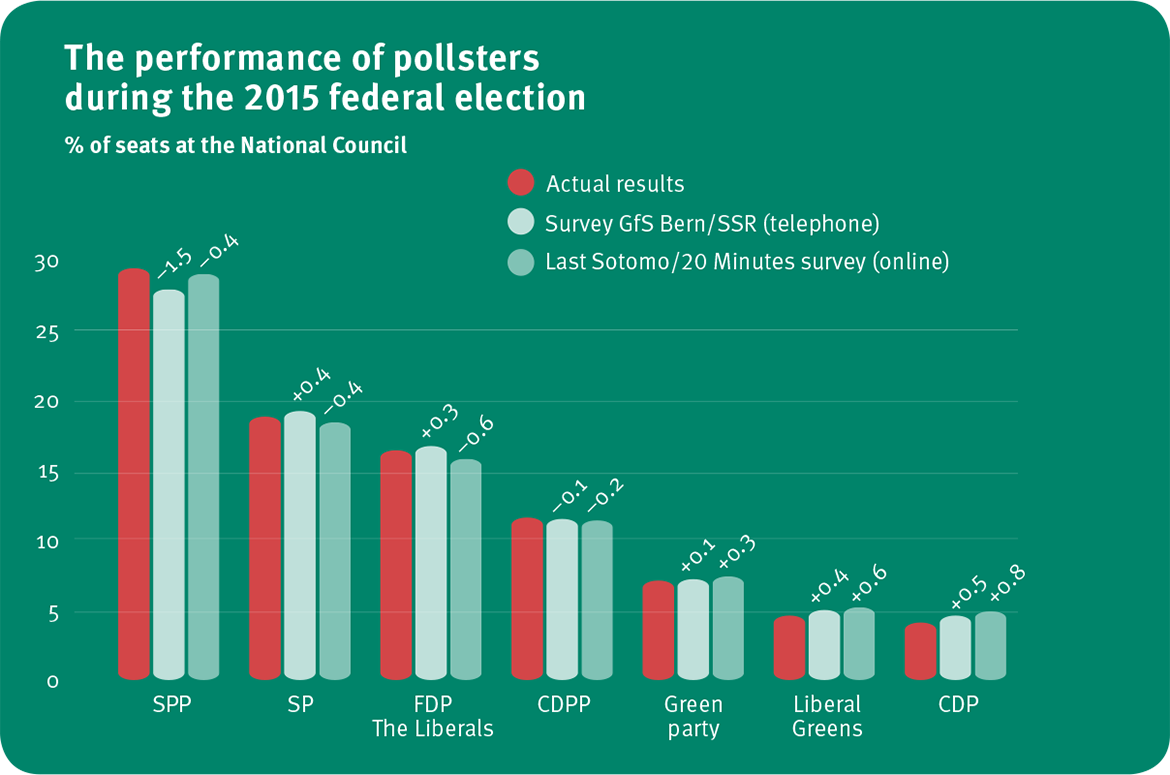
Sources: Swiss official statistics, GfS Bern, 20 Minutes.